
Fix the event and the unit you count
An activation rate needs a shared definition of completed work. In an illustrative expense-management product, an employee submits a report and a manager approves it. Use the first approved report in a company account as the first result. Reimbursement happens later and falls outside this activation definition.
Count accounts for this analysis. Several employees may prepare reports while a manager approves them, but the product team is studying whether the company has started the shared workflow. Treating these people as independent new users would split one company’s work into separate paths and lose dependencies between their roles.
The approval event needs an account ID, a timestamp, and a successful decision status. Check a few events against the underlying records: the report was approved, the time matches the action, and the account is correct. An approval-screen view or a queued request captures an earlier step. Including either in the endpoint would make the activation rate answer a different question.
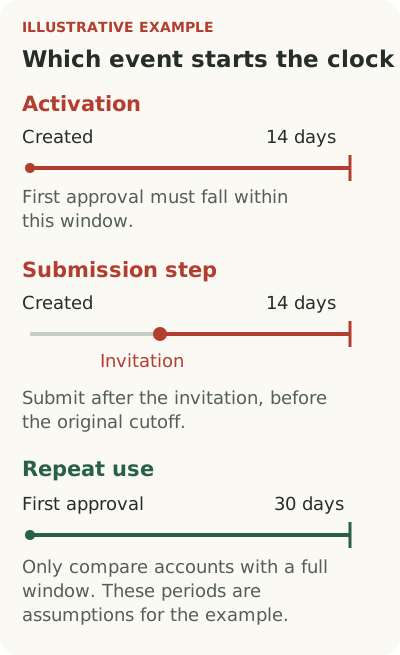
Activation and repeat use start different clocks
Allow a new account 14 days from creation in this example. Activation is the number of accounts with a first approved report within that period, divided by all new accounts in the selected cohort. Every account must have had the full 14 days of observation. This window is an assumption for the exercise; choose a period that fits your customer’s workflow in your own analysis.
The submission step has a narrower denominator. Take accounts in the same cohort that invited an employee during their first 14 days. Count the subset with a first report submitted after that invitation and before the same window closes. The clock still starts at account creation: an invitation does not grant another 14 days. Put that condition in the metric’s definition so readers do not mistake it for submission within 14 days of invitation.
Repeat use starts from the first approval. Among accounts whose first approval was at least 30 days ago, count the share with another approval within those 30 days. The numerator must come from that denominator. An account with its first approval yesterday is not yet eligible for a full-window comparison, even if it has already recorded a second approval.
Keep these definitions beside the report. They explain why activation, submission, and repeat use have different denominators. Without them, two people can read the same percentages as measures of different things.
Work through a cohort of 40 accounts
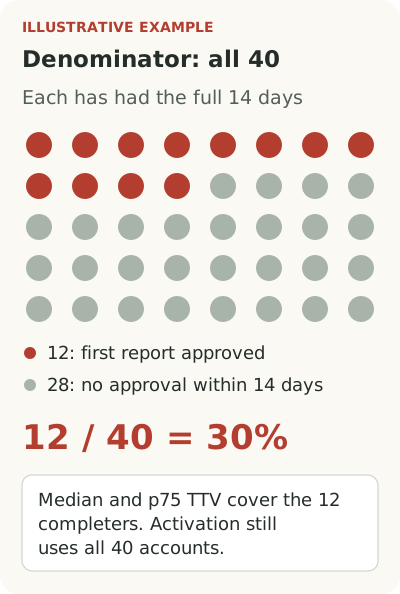
Suppose 40 accounts were created in one week and all have now completed a 14-day observation window. Twelve received their first approval within that window. Activation is 12 / 40 = 30%. These are fictional numbers for a worked calculation, not a benchmark or a product result.
All 40 remain in the denominator. The other 28 did not reach the chosen endpoint within the window; this calculation does not establish that they will never reach it. Adding yesterday’s sign-ups would give part of the cohort less time to finish and change what the percentage describes.
For TTV, take the elapsed time from account creation to first approval for the 12 completers. The median and p75 of that sample apply only to them. The other 28 have no measured time to the outcome within this window and are absent from the time calculation. Put “12 of 40 within 14 days” beside the time measure so readers can see which portion of the rollout it describes.
Then examine the transitions. An account that invited an employee but has no submission calls for a look at that part of the job. An account with a submitted report calls for a look at the wait for approval. Join employee and manager events by account; the team’s sequence of work is not one person’s journey.
Investigate the cause of the delay
An absent manager, missing receipts, and a failed notification could each create a delay between submission and approval. The funnel identifies accounts in which to investigate those possibilities. Inspect a few delayed reports, who received the request, and what the employee could see. That gives you grounds to choose between repairing a notification, explaining document requirements, or changing the workflow.
Keep track of event definitions too. If the team changes what counts as approved, recalculate older cohorts under the new rule where the records allow it, or start a separate series. Joining the percentages without that adjustment mixes a tracking change with customer behaviour.
A higher activation rate among accounts that saw a tip does not establish the tip’s effect. The product may have shown it to employees who had already started submitting and had a better chance of finishing. To estimate a causal effect, define eligible accounts, the endpoint, and the window in advance, then randomly assign accounts to guidance or control. Account-level assignment keeps people contributing to the same workflow in the same variant.
With a small customer base, a few completions can move the percentage a great deal. Observing work helps explain delays, but does not replace an assessment of uncertainty about the effect. Distinguish what you verified in the records from what still needs an experiment.