Decide which result stops the clock
For a sales analytics product, a useful first result might be a sales lead opening a report built from their company’s checked data. Use that as the endpoint in this illustrative example, with workspace creation as the start. Data quality and the lead’s access are part of the definition. Whether the lead makes a good decision with the report falls outside it.
Now consider an import that falls short. A customer uploads an export and sees “Import complete.” The dashboard is missing deals because the file uses a different name for the status column and the admin mapped it to the wrong field. The upload succeeded, but the lead cannot use the figures in their meeting. Under the chosen definition, the account has yet to reach its first result.
Upload completion is still a useful technical event. Ending TTV there, however, would leave out the time spent finding and repairing this error. Write down the boundaries before you calculate, then check a few accounts against their records. Two reports labelled TTV are comparable only if they use the same starting point, outcome, and unit of analysis.
Account for the gaps between events
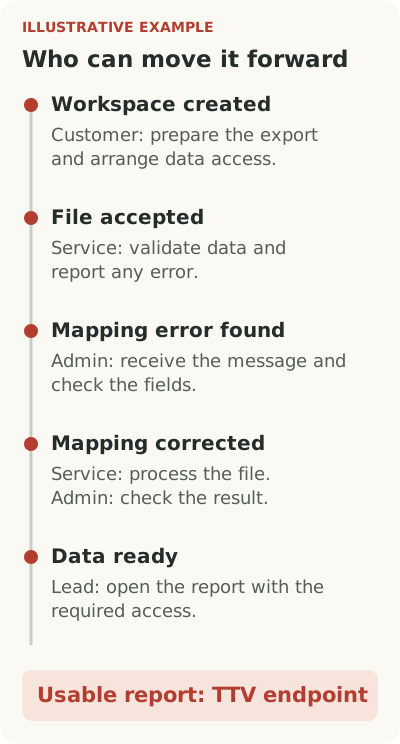
Trace one account from workspace creation through file acceptance, error detection, correction, and the first usable report. Product events will supply some timestamps. Others may require a conversation with the customer or a support history you have permission to read. Keep an unknown interval marked as unknown; the gap may include work outside your interface.
For each pause, identify who could move the process forward. Between error detection and correction, the admin might have been checking columns or might not have known there was a problem. To distinguish those situations, find out when they received an actionable message and opened the mapping screen.
Work before upload can also belong to the measured journey. A customer may need internal approval to export data after creating the workspace. Your team cannot grant that approval, but you can explain the requirement and who on the customer’s side needs to arrange it. That gives the person a chance to prepare before they reach the upload form.
The timeline should help you choose a change. A long-running import calls for an investigation of processing time. A delayed admin response may call for a clearer notification. Repeating the same column-mapping work suggests saving approved mappings for the next upload. Those are separate problems despite all contributing to one TTV figure.
Keep the checks that protect the report
In the status-column example, validation protects the meaning of the sales figures. Removing the check could deliver an incomplete report sooner. Instead, make the check easier to perform: show the source column, its destination field, and sample values from the uploaded file. The admin can inspect the mapping before it affects the report.
Show only the state the product has confirmed. “File received” describes a completed upload. “Check the Status column” gives the admin a task. “Data ready for reporting” describes a later state. Pair each with the action available at that point so the customer can repair the file or continue without asking support what happened.
Customers also arrive with different constraints. Some have a prepared export; others need approval or must combine several data sources. If the next cohort contains more straightforward imports, the overall median may fall without a product change. Compare similar setup paths to see where people are making progress sooner.
Report the share that arrived alongside the time
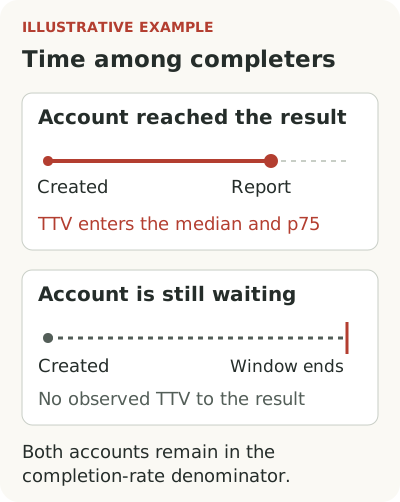
Assess the change with two measures: the share of new accounts that got a usable report within the observation window, and the time taken by those accounts. In a calculation restricted to completers, the median and p75 describe only accounts that reached the endpoint within the window. The remaining accounts have an observed wait, but no measured time to that result by the cutoff.
Keep the original cohort size, completion share, and observation window beside TTV. Otherwise the quick rollouts contribute a time while the accounts with the longest unresolved delays disappear from the calculation. A median alone will not show you that omission.
Choose a window suited to the customer’s work. If you allow two weeks from workspace creation in an illustrative analysis, compare cohorts in which every account has had those two weeks. Yesterday’s sign-ups have not had a full chance to finish. Keep the outcome definition and observation period identical across the groups.
After changing the import flow, return to the interval you intended to improve. Check whether admins learn about the mapping error sooner and can correct it from the message. Then examine the share of accounts with a usable report and the time among those that arrived. This connects the overall metric to a part of the rollout you can inspect, while leaving open whether your change caused the movement.