
Test the relationship between activation and retention using mature cohorts, predefined windows, and consistent definitions. If activated customers return more often, that's a useful signal, but it doesn't prove that activation caused retention.
Suppose a financial planning service notices that companies that set up three reports in their first week return more often after a month. The team decides to require everyone to create three reports. That's premature. Those companies may have arrived with data and a task ready to go; the report count may only signal that need.
Compare mature cohorts and check for self-selection
For example, for accounts entering in January, define activation within the first 14 days and retention as at least one work action on days 30–60 after entry. Include only accounts whose window through day 60 has ended; keep zero outcomes and the sizes of both groups in the table.
| Step | What to check |
|---|---|
| Definition | The same access, activation, and work-return criteria for the entire cohort |
| Comparison | Retained shares among activated and non-activated accounts, with numerators and denominators |
| Context | Sales channel, role, customer size, and implementation support known before the outcome |
| Repeat | The same check on the next mature cohort, without selecting the event after the fact |
Suppose activated accounts return more often because their data is ready and they have a designated administrator. Those conditions may influence both the early action and the return. The difference helps assess the signal, but doesn't prove that forcing the event will improve retention. A causal question needs a separate intervention design.
The signal must mean something to the customer
Start by asking what value the action confirms. One valid forecast using real data may mean more than three empty template reports. Completed setup is useful if it lets the customer make a decision. If an action exists only for a counter, trying to raise the metric can easily break its relationship with future behavior.
Describe the minimum signs of a working outcome. For the financial service, these might be uploaded data, a calculated forecast, and a review by the decision-maker. Don't include every good habit at once. A criterion that's too late won't help you understand the first experience quickly; one that's too easy will record only an introduction to a screen.
In an interview with Lauren Schuman of Close, the discussion of growth returns to the customer's task and the meaning of the experience, even as new technologies emerge. This order helps when choosing an early signal: first a clear outcome, then an observable indicator. Another product doesn't supply a ready-made activation threshold for yours.
Start with definitions in onboarding metrics.
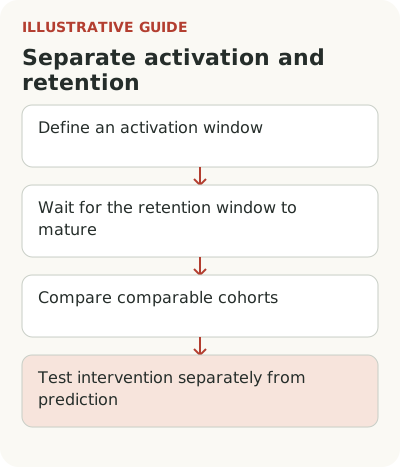
Separate activation and retention windows
If activation means an action in the first week, look for the subsequent return after that window. Otherwise the same work can partly enter both metrics, making the relationship strong by construction. Fix the cohort entry point and give everyone the same available time for the early action.
Don't compare customers who have already had a month with those who arrived yesterday. Each retention point needs mature observations. Amplitude's documentation explains how calculation accounts for a complete period and how return on an exact day differs from return on that day or later. Those differences change the answer.
Choose the return action based on the product's work frequency. Daily sign-in may be unnecessary for a monthly forecast. Returning to the next forecast says more than opening the home page. For daily order processing, a monthly window might hide the loss of routine work by the second week.
Check alternative explanations
Compare the relationship within important segments: data readiness, account size, acquisition channel, role, and implementation help. Perhaps the customers creating three reports are mostly those whose manager helped upload history. The early event then reflects both data availability and support.
Don't split a small customer base into dozens of groups. Start with a few differences that could plausibly affect both the early action and return. Show group sizes and uncertainty. If the relationship disappears after segmentation, that's useful for choosing a metric, not a reason to put the overall average back on the slide.
Check time to action too. A customer who managed to create a report had already stayed in the product long enough to do so. If groups are defined after different observation periods, you may accidentally compare people with different opportunities to become “activated.” A common early window helps avoid part of that error.
For an early signal, examine how to choose an activation event.
Don't pick a winner from hundreds of events without validation
If you try enough actions and thresholds, some will show a compelling relationship in existing history. It may be chance or a feature of one cohort. Keep a separate later period to validate the chosen definition, and don't tune it after every inconvenient result.
For a practical choice, compare a few meaningful candidates that you can explain through the task. For example: a valid forecast, a forecast shared with a manager, or a repeated forecast. Each has a time to availability, a relationship with retention, and usefulness for an early decision. The latest candidate often describes sustained work better, but helps less with improving the first session.
Don't look for one permanent signal. Its meaning can change with the audience, plan, or main scenario. Schedule a review after major changes and retain definition versions. Don't present historical growth caused by a new formula as improved customer behavior.
Test the intervention separately from prediction
A predictive metric answers which customers stay more often. An onboarding change asks whether you can help more customers achieve a useful outcome. Even if an early action predicts return well, a new way to prompt it needs a separate evaluation.
In the hypothetical example, help uploading real data may have a different effect from requiring three empty reports. Both changes will raise the counter, but only one addresses the proposed cause. First describe the mechanism and check outcome quality, then observe later behavior under comparable conditions.
Keep observations that contradict the chosen signal too. Accounts without three reports may work successfully with one shared forecast because their process differs. Don't automatically label them unactivated. Check the alternative scenario and, if the product needs it, define a separate early outcome. The metric should help recognize useful work by different target customers. When exceptions become a normal way to work, fix the definition rather than persuading customers to do extra work for your model.
An A/B test plan can help assess an intervention's effect.
Start with a definition you can explain
Take your current activation metric and ask: can a user complete it without receiving value? If so, refine the criterion. Then check consistent windows, cohort maturity, and major customer differences. Record what the data doesn't yet establish instead of filling the gaps with confidence.
Finish with a simple document: action, useful meaning, deadline, unit, return rule, and limitations. A good early signal helps the team learn and choose changes. When people perform it for a report, it stops reliably describing customer work. That's a reason to fix the definition, not demand more clicks.