
An onboarding A/B test compares outcomes across groups assigned in advance to estimate the effect of a specific change. When B2B customers work together, randomization by account, a common outcome window, and checks on errors and support are usually important.
Suppose a contract management service shortens its initial checklist. A month later, more companies have sent their first contract for approval. That's a reason to test a hypothesis, not proof. If sales managers also began bringing in customers with electronic signatures already configured, some of the increase may have occurred without the checklist change.
An account-level experiment card
Before release, agree on a card for the hypothetical contract service:
| Field | Decision before the start |
|---|---|
| Audience | New accounts with the necessary access and a contract; conditions defined before assignment |
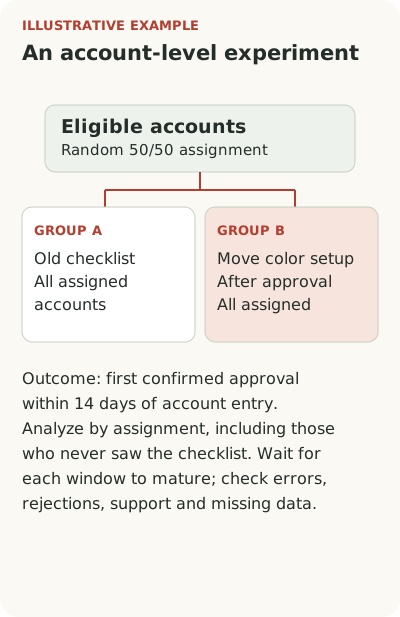
| Assignment | Random 50/50 assignment by account; everyone in an account receives the same variant |
| Variants | A: old checklist; B: move the color setup step until after approval |
| Outcome | Share of all assigned accounts with a first confirmed approval within 14 days |
| Guardrails | Errors, approver rejections and support requests per account in the same window |
| Checks and decision | First check delivery, missing data and allocation; then assess the difference with uncertainty and a predetermined decision rule |
Determine the number of accounts and recruitment duration before the test, considering the baseline rate and minimum useful effect. Analyze accounts by their assigned variant even if some people didn't see the checklist; the final account's window must mature. Random assignment doesn't guarantee freedom from data problems or mixed variants.
Write down the effect you want to test
State the change and expected mechanism. For example: “Remove brand color setup before the first approval so the administrator can send a working contract sooner.” This distinguishes a useful sequence from a general wish to “improve onboarding.” It also makes the data needed clearer.
Define one primary metric: the share of eligible new accounts that complete their first approval within the specified time. An eligible account has the necessary permissions, feature access and a working contract. Specify when the clock starts. Also choose measures that guard against harm: errors, approver rejections, support load or incomplete operations.
Define the practical meaning of the effect in advance. What change in behavior would justify maintaining the new version? This isn't a promise that the result will occur or a demand for a statistically attractive number. A threshold helps avoid a decision based on “something went up” when costs and risks remain unchanged.
The primary metric should match the activation definition.
Choose the unit of comparison before launch
In a multi-user service, one employee creates a contract, another approves it and an administrator changes settings. Assigning different variants to these people mixes conditions within one workflow. For that scenario, consider assigning a variant by account rather than individual session.
The number of independent units is then the number of accounts, even if they generate thousands of events. Repeated clicks don't turn a few companies into a large sample. The analysis must account for the chosen unit. Otherwise, precision is overstated: the system counts the same organization repeatedly as new independent observations.
Keep assignment stable. A user shouldn't see the old checklist in the morning and the new one in the evening merely because they opened another browser. Record assignment and actual availability of the change separately. This helps check delivery without excluding people who didn't reach the screen from the outcome.
Randomized control helps when done properly
Randomly assigning eligible accounts to variants helps separate the change's effect from some external differences. First, however, check that assignment works, events arrive consistently and one variant doesn't lose data more often. The label A/B alone doesn't guarantee a valid experiment.
Microsoft Research discusses sample ratio mismatch as a signal of problems with group composition and experiment quality. In the researchers' example, filtering users changed the conclusion about the result. The practical lesson for an onboarding team: check allocation and data loss before estimating the effect, not just final conversion.
Base the primary analysis on the groups assigned in advance. Comparing only people who opened the checklist can reintroduce bias: opening itself depends on the variant and the person's motivation. Examining those who actually saw the guidance is useful as additional diagnosis. It must not quietly stand in for the effect of release on the entire assigned audience.
When evaluating help, distinguish tour completion from working outcomes.
Narrow the conclusion if there is no control
Sometimes random assignment isn't available: the change has already shipped, there are few companies, or contracts require a common process. A before-and-after comparison can still reveal movement, but the conclusion must remain observational. Record concurrent changes, cohort composition, the amount of manual assistance and whether the windows match.
You can seek a comparable group that didn't receive the change and compare movement in both groups. But similarity in plan and company size doesn't make groups identical in hidden motivation. Methods such as difference-in-differences have their own assumptions, including plausible similarity of trends without the intervention. Naming a method doesn't remove the need to check them.
In the hypothetical contract service, the team could examine companies acquired through a new sales channel separately. If the movement disappears after excluding them, the checklist hypothesis weakens. If it remains, other explanations still exist. An honest statement is: we observe improvement under comparable conditions, but haven't established causality.
Check manual assistance across variants too. If a manager sees a new account stuck and helps only one group, the comparison starts to include that intervention. Sometimes the team wants to assess that package: guidance plus support. Define it that way. If the question concerns the checklist alone, agree on the same support rule and retain actual requests. In complex B2B work, removing human involvement entirely may be impossible; understand which part of the process is being compared and which actions might change the outcome.
Also check whether every participant has enough time to achieve the result. A new account on the last recruitment day hasn't completed its observation window. Wait for it to mature or use a valid analysis method chosen in advance. The calendar end of a release doesn't complete the customer's work cycle.
With low traffic, first assess the limits of an A/B test.
End the assessment with a bounded decision
Before launch, agree on the observation period and stopping rules for the chosen analysis method. Don't pick the lucky day when the chart first turns green. Don't check dozens of metrics indefinitely to find one winner. PostHog's documentation discusses uncertainty, sequential analysis and the problem of multiple metrics; configuration requires understanding the chosen approach.
The report should include the size of the observed difference, its uncertainty, guardrail checks and data quality. Sometimes the result cannot distinguish a useful change from no effect or harm. The team can then collect more data, revisit the hypothesis or make a reversible decision on other supported grounds, without calling it a proven win.
Start with a card for one upcoming change: audience, assignment unit, outcome, window, control, data loss and decision rule. Show it to an analyst and engineer before release. It's cheaper to fix the plan in advance than to discover after launch that variants mixed and the success event meant opening a form.