Product tour metrics should show the work a user accomplishes as well as progress through guidance. Count reach among eligible users, completion among those who started, and the useful action separately. Each denominator answers a different question.
Consider a service that helps small agencies prepare estimates and send them for approval. A new user completes six steps and sees the editor, templates and send button. But they don't create an estimate. The client receives nothing. However good the completion report looks, the introduction hasn't yet produced value.
How to count reach, completion and outcomes
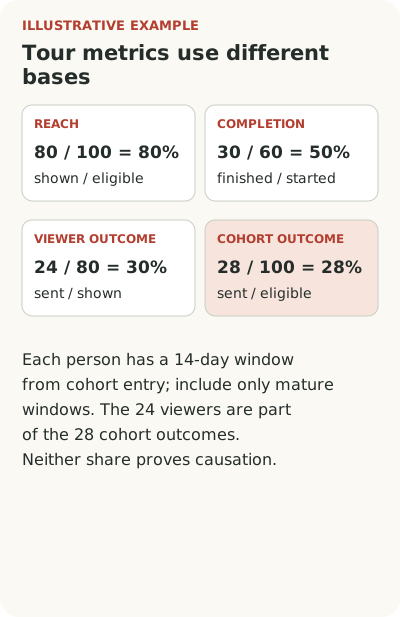
In this hypothetical example, a cohort of 100 eligible new users is recruited over two calendar weeks. Each person's separate 14-day window starts when they enter the cohort; include them in the final calculation only after their full window has matured. Within those individual windows, 80 people are shown the tour, 60 of them start it and 30 finish. After being shown the tour, 24 viewers send a working estimate; 28 people in the whole cohort achieve the result. Count each user once, and tie exposure and outcome to the same version of the workflow. The recruitment period and observation window are different.
| Metric | Calculation | Question answered |
|---|---|---|
| Reach | 80 / 100 = 80% | Which eligible users were shown the tour? |
| Completion | 30 / 60 = 50% | Who finished among those who started? |
| Outcome after exposure | 24 / 80 = 30% | Which viewers sent an estimate within the window? |
| Cohort outcome | 28 / 100 = 28% | Who achieved the result among all eligible users? |
The last two shares have different denominators: the 24 are included in the total of 28. Neither proves that the tour caused the result. That requires a control planned in advance, not a comparison of viewers with people who didn't see it.
Name the outcome without using the word “tour”
Try completing this sentence: “After the introduction, the user can…” The answer should describe work in the product. In the estimate service, it might be an estimate with correct line items sent to a real recipient. For internal approval, the outcome would be different: a manager receives the document and can make a decision. Showing where the buttons are is insufficient for either.
There is no universal threshold. One product may deliver a useful result in the first session; another may require data from a colleague. Choose and explain a window that fits the work cycle. If an estimate usually takes several days to prepare, a first-hour metric shows the speed of getting ready to work, but not necessarily activation.
In an interview with Lauren Schuman, VP of Product Growth at Close, the discussion of onboarding starts with customers' jobs and the problem the team solves, rather than a choice of new technology. That order helps with a tour too: define the work first, then decide which explanations support it. Close's experience doesn't provide a ready-made metric for your product.
The choice of working outcome and window builds on general onboarding metrics.
Separate three events in the report
For the estimate example, answer three questions separately: who saw help, who used it, and who completed the work. “Tour shown,” “tour completed” and “estimate delivered” describe different things. Confirm the last event with a successful operation, not just a button click: sending can fail.
Keep the events tied to a user and account, the workflow version and time. Otherwise, completion of an old tour may enter a report about a new one, or a document created by a colleague may accidentally count as the newcomer's individual achievement. In B2B, the account outcome is sometimes the one you need. Name it as such rather than calling it individual activation.
Count the share achieving the outcome among all eligible new users within the chosen window. Show the share among tour viewers separately. The second helps investigate the path after exposure; the first retains people who weren't shown help. Quietly excluding them makes a presentation easier and a decision worse.
Find four combinations of behavior
A user may complete the tour and achieve the result, or complete it without the result. They may skip the explanation and still do the job, or do neither. Keep all four groups: each raises a different research question.
The second group is especially useful to investigate. Perhaps the tour requires repeated “Next” clicks but doesn't help prepare data. Perhaps the user understands the interface but is waiting for administrator permission. Or sending the estimate fails during address validation. Each cause needs a different fix. Making the tour longer in every case makes no sense.
The third group guards against unnecessary work. If an experienced manager quickly prepares a document without guidance, skipping the tour isn't failure. Mandatory completion would only add steps. Check these users' roles, prior experience and task types before urging everyone to watch the same training.
If the outcome isn't defined yet, start with choosing an activation event.
Check whether the tour creates a false outcome
Sample data often makes a demonstration easier to understand. But sending a sample estimate to yourself isn't the same as working with a client. Don't prohibit the trial: it may reduce fear of making a mistake. Keep a training-mode marker and don't mix it with a full working outcome.
The same problem arises when a tour performs an action automatically for the person. A document exists and an event is recorded, but the user hasn't learned how to repeat the operation. Check a later independent action if repetition is natural for the product. A repeat in the next few days is a poor requirement for a rare task; it may be a useful signal for daily estimate preparation.
Check outcome quality too. An estimate with empty amounts is formally created but can't be sent. A few minimum conditions can distinguish a usable document from a draft. Don't turn activation into a long list of ideal behavior: an early signal should support decisions, not select the most compliant users.
Learn the person's intent on entry as well. Some came to compare the interface; others are already preparing a client document. Distinguish their outcomes if you can obtain intent reliably. But don't remove “explorers” from the overall cohort after the fact just because they didn't activate. Segment conditions must exist before the outcome. Otherwise, the metric rewards the team for removing inconvenient users from the calculation. For each segment, retain its size, observation period and an explanation of the decision the breakdown supports.
The guide to product tour dismissal can help investigate why people close guidance.
Change the help for a specific cause
Start with a few recordings or observations of the task, following your rules for access to user data. Compare stopping points with errors, support questions and events. Don't draw a conclusion solely because someone closed a tooltip: they may already have received the explanation they needed.
If people confuse estimate types, a short tooltip beside the choice may help. If they don't know the preparation sequence, a checklist may be useful. If a failure prevents them from importing line items, the product needs a fix. Assess tours and contextual guidance, including those in Flowtomate, as ways to help with a specific step, not as onboarding outcomes in themselves.
Before making a change, record the activation definition and window. Afterward, compare working outcomes for comparable cohorts, error counts and need for help. An increase after release still doesn't prove causation: different customers may have arrived at the same time. For a first step, open the current report and check whether it includes an event that confirms value without mentioning the tour. If it doesn't, start by defining the outcome.