
An onboarding dashboard should help a CPO decide where to fix the product, change guidance or check the data. Start with the incoming cohort, first outcome, time, repeat use and guardrails; define each block and its limits.
Imagine a B2B service that helps stores manage inventory. A new account must connect a data source, obtain a correct stock balance and use it when placing an order. The team already reports registrations, email opens and tour views. Those figures don't show whether a store reached useful work. The report can be rebuilt without a large customer health scoring system.
Which blocks does a product leader need?
A dashboard connects a number to a choice, rather than merely collecting charts. For the hypothetical store cohort, record the entry date, “account” as the unit and a 14-day window. Show numerators and denominators with percentages.
| Block | Definition | Decision | Limitation |
|---|---|---|---|
| Entry | Eligible new accounts | Check the composition of the incoming flow | Changes in acquisition channels change its composition |
| First outcome | Correct stock balance within 14 days / entire mature cohort | Investigate setup stoppages | New accounts must wait until their window ends |
| Time | Time to outcome and number who didn't complete | Remove setup delays | The median among successful accounts hides the rest |
| Repeat | Working order in the next available cycle / accounts with that cycle | Check whether work continues | No repeat need doesn't mean rejection |
| Guardrails | Errors and support requests per eligible account | Identify the cost of a change | Complete data on manual help is needed |
An owner and review date make this table a working report. Growth after release remains an observation until the comparison design allows the team to estimate the change's contribution.
One screen should answer four questions
First, how many eligible accounts started onboarding? Show the size and composition of the incoming cohort by meaningful segments. Second, how many achieved a first working outcome within the chosen period? Third, where did people stop and how long did they wait? Fourth, did they return to work in the next natural cycle?
Keep guardrails nearby: connection errors and support requests for the selected workflow. They show the cost of changes in the primary measure. If more stores connect data but support then corrects balances manually, higher activation isn't a reason to close the issue. Check the definition of a successful connection.
Agree on the meaning of the outcome first. In a conversation with former Rillion VP of Product Francesca Smedberg, key questions include where onboarding ends and how teams share the work. A dashboard starts with that agreement. Different definitions don't become one process just because they're displayed side by side.
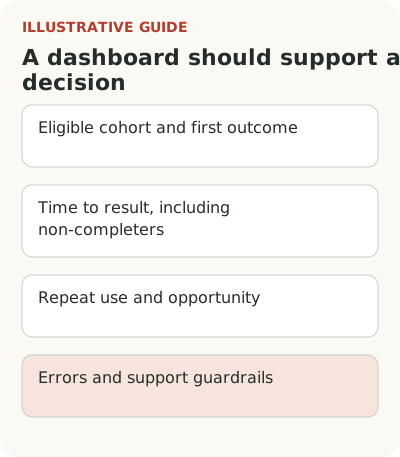
Agree on the core onboarding metrics before building the report.
Connect each row to an action
For the hypothetical inventory service, a small report might look like this:
| Metric | How to read it | Decision it supports |
|---|---|---|
| New eligible accounts | Cohort count and composition | Has the customer flow changed? |
| First correct balance within 14 days | Account count and share of cohort | Where is the first outcome being lost? |
| Time to outcome | Median, upper part of distribution, non-completers | Who is held back by lengthy setup? |
| Repeat working order | Accounts from a mature cohort | Does value continue after the start? |
| Errors and help | Failures and requests per eligible account | Does apparent success hide manual work? |
Fourteen days is only an illustrative window. Replace it with one that fits your implementation. If the customer's IT team connects the source, show the wait for that external action separately. Otherwise the team is held responsible for time it cannot shorten with on-screen copy.
Don't show percentages alone. A share based on seven stores is less stable than one based on seven hundred, even if the percentages look alike. For small cohorts, exact numerators and denominators carry more meaning than a rounded trend with a green arrow.
Compare equally mature cohorts
A store that registered yesterday hasn't had a full fourteen days. Compare it with an account that entered a month ago and the newer cohort loses by definition. Show entry date and sufficient observation time. For immature cohorts, label values preliminary and show how many accounts can still complete the workflow.
Retention has the same trap. Amplitude's documentation distinguishes returning on an exact day from returning on that day or later. The method changes the calculation. A label saying only “retention” is too vague: state the action that counts as a return and the window used.
Show one primary breakdown when it changes the decision. For example, compare self-service connections with manager-assisted implementations. There's no need to add dozens of filters in advance. If the average worsened only because complex implementations increased, a breakdown explains why; an overall chart without cohort composition may prompt the wrong fix.
Also check that tour completion doesn't replace a working outcome.
Don't hide non-completers in the time metric
Average time among successful connections can improve if the most complex stores stop completing setup altogether. The report would show acceleration even though the product got worse. Put the share of non-completers beside time, along with the reason for stopping when known.
Useful queue states include waiting for customer data, encountering an error, requiring permission setup and ready to work. This doesn't require a complex score built from hundreds of signals. A few verifiable states can assign work: an engineer fixes the import, customer success contacts the administrator, or product removes a confusing choice.
Don't present an unknown cause as confirmed. If events aren't sufficient, “unknown” is more honest than an automatic “not interested” category. Attach a concrete action to it: check the data or speak to an account representative. The report then helps reduce uncertainty.
Agree on a source of truth for each row. Take created accounts from the application, confirm working outcomes through successful operations, and take requests from the support system. If numbers disagree, first check definitions, time zone and delivery delay. Don't pick the source with the nicer number. Show the calculation owner and last update date alongside the report. If data is missing, show the gap. An old number without a date can become the basis for a new task even though the problem has changed.
Manually reconcile a key row with individual accounts once. Open several examples of success and stoppage; check their events and available time. If the report conflicts with what happened in the product, fix the calculation first. More detail doesn't compensate for an incorrect primary metric.
A new feature will need an eligible-audience denominator.
End the meeting with a decision, not another chart
Before a review, ask each metric owner to prepare one hypothesis and its basis. For example, the error share rose among stores using a particular source, so the team will check file-format handling. Don't frame the task as “increase activation.” Name the failure, audience and observable outcome of the fix.
After the meeting, save the decision beside the change date. Start the next review by checking it: what was done, which accounts received the change and whether enough time has passed. If the cause wasn't confirmed, change the hypothesis. A chart doesn't have to prove that the previous decision was right every time.
An initial version can be a table using existing data. Take one recent mature cohort, label definitions and remove metrics that don't support a decision. A new dashboard is needed only when manual review already helps and repeating it has become costly.