
Measure B2B SaaS account activation by the outcome of shared work, and show each person's contribution separately. Set role rules and the observation window in advance: the share of participants is not the share of accounts that completed a shared task.
Imagine a business travel approval service. An administrator sets the rules, an employee submits a request, a manager approves it, and an accountant processes payment. Four people can use their own screens successfully while the whole process stalls because one approver is missing. Individual success and account outcomes are connected, but they aren't the same.
For early activation in the example below, choose the first completed approval cycle for a real request. Payment is a later outcome, checked separately. That is the boundary of this calculation, not a claim that approval and payment offer equal value.
A numerical example: people and accounts
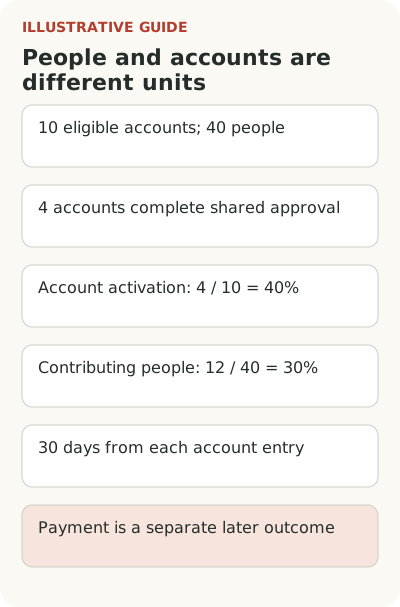
A hypothetical cohort has 10 eligible accounts and 40 employees with access. Count 30 days from each account's entry into the cohort; include only accounts whose full window has elapsed. In four accounts, an administrator configured the route, a requester submitted an application, and an approver made a decision in that same account. That is 4 / 10 = 40% of accounts activated, with activation defined as completed shared approval.
If each of those four accounts has three different participants, and the other 28 employees didn't complete the corresponding action, the share of people with a confirmed contribution to the chosen approval is 12 / 40 = 30%. That is a share of people with that contribution, not a share of activated accounts. In this example, different people fill the three roles; actions from different companies don't make one shared outcome.
Record the account entry date, required roles, and the same 30-day window. Handle invited people and role changes according to rules chosen in advance. If one role can perform several actions, don't treat the requirement for three different people as universal.
Start with the unit of value
Ask whose outcome the product promises. If an employee keeps personal notes, individual use may be the main level. If a company handles business travel through a shared route, the account outcome matters: the request passes through the required roles and reaches completion. An administrator signing in doesn't establish that.
Define the account boundary. It could be a legal entity, workspace, or branch. Don't treat them as interchangeable: one contract may cover several workspaces, and one workspace may serve several departments. The choice should fit the task under analysis and remain stable in the report.
In the Segment Group specification, users and groups have separate identifiers, and a user can belong to several groups. This example helps frame the technical question: an event needs the context of the organization in which the action occurs, not just the employee's persistent profile.
The account outcome complements the general set of onboarding metrics.
Define each role's contribution
For an administrator, the first outcome is working rules and a verified route. For an employee, it's a valid request. For a manager, it's a decision. The accountant has a separate outcome. These measures help locate a delay: perhaps requests are easy to create, but managers don't get a clear next step.
Don't expect the same activity from every licensed seat. A manager may sign in only to approve requests, and an accountant at the end of a period. Daily sign-in isn't a general measure of health for such an account. State the natural frequency and the condition under which each role actually has a task.
Keep invited employees who haven't started separate. They may be waiting for a real trip. Or they may not understand the invitation or have the right permissions. Product events give you a reason to investigate; they don't reveal intent. With a small number of accounts, a short conversation with the person responsible is often more precise than an automatic “inactive” label.
Combine roles into an account outcome
You don't have to require every employee to perform every action. In our calculation, the early activation chain ends when rules are configured, a real request is submitted, and the required manager approves it. Show confirmed payment as a separate subsequent outcome. If your product's first useful result is payment itself, include it in the final event and recalculate the share: the 4 out of 10 above don't establish payment. Mark training workflows explicitly so a trial route isn't mistaken for a company ready to handle real trips.
The window depends on the work cycle. If trips are rare, a week without a new request says nothing about abandonment. You can check the success of the next real task and track waiting time separately. Don't make a company create unnecessary requests for a metric chosen to make a weekly report convenient.
For retention, choose a repeat of the valuable process in the next eligible period. State which accounts had an opportunity to repeat it. In Amplitude's retention documentation, the calculation depends on the start event, return event, and maturity of the observation period. At account level, these definitions also need explicit decisions.
Participant contributions connect to inviting colleagues into the product.
Keep two connected layers in the report
At the top level, show the share of eligible accounts that achieved the first and repeated working outcome within the chosen windows. Below that, show completion of each part by role, errors, and waiting. The CPO can see the business outcome while the team gets evidence for changing a particular screen or invitation.
Start with one process and describe the sequence of roles in words. At every transition, state who acts, what confirms success, and in which account. Then inspect the current analytics: are there enough links to reconstruct one real chain? If not, fix the tracking first. Debating the one “correct” metric without that foundation will only take another meeting.