
If users don't activate after signing up, find their last confirmed step and investigate what blocks the next one. Leaving the app at the same point can mean that someone doesn't understand the file format, is waiting for access, or doesn't yet have a task to complete. Each calls for a different response: guidance, an access handoff, or a clearer promise before signup.
Start with one journey and the people eligible to take it. Neither an overall activation rate nor a session recording without context can explain the cause on its own. The goal is to connect the stopping point to a testable obstacle and someone who can fix it.
Find the transition where work stops
Suppose a product helps managers find overdue invoices. New accounts appeared during the week, but almost no reports were completed. The team proposes a welcome tour. It doesn't yet know whether a tour would help: a report first requires an export from an accounting system, and the accountant creates that export.
Break the journey into states: the person opened report creation, chose a source, started an upload, received data, and produced a result. Each state needs a verifiable condition. Clicking “Upload” doesn't mean the file was processed. Visiting a page doesn't prove the person tried to work.
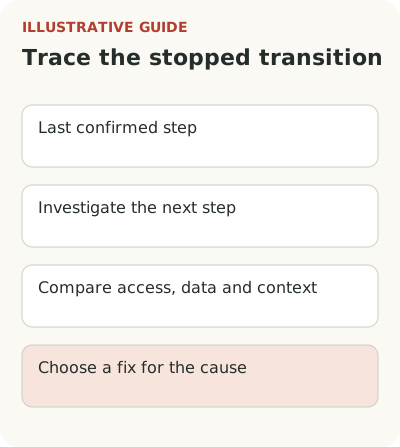
Choose the last confirmed state and the first one they didn't reach. The final step should match the activation event, not a formal page view. The gap gives you a specific research question. “Why aren't people uploading a file?” is more useful than “Why is onboarding bad?” A chart alone still can't answer it: it shows where people stop, not why they made that choice.
Check the audience and window before discussing conversion
Check the data before discussing the interface. Do new registrations include employees, duplicate accounts, invited viewers, or people whose current plan doesn't give them access to the feature? These are different situations. An overall percentage can easily hide their mix.
Define the unit of measurement. If an accountant prepares a report and a manager reads it, you can't expect every participant to create one. Count whether the account reaches the result, and study each role's actions separately. Otherwise a successful team will look like one active user and several failures.
The general rules for units and windows are covered in onboarding metrics. Here, fix a window, such as the first working week after account creation. This is an analysis condition, not an industry standard. Let every cohort complete the entire window. The PostHog funnel documentation describes a conversion window: people who don't complete the journey within it count as drop-offs. Mix yesterday's signups with week-old ones and you'll create part of the drop yourself.
Reconstruct an attempt with the user
Find people who stopped at the chosen transition and invite them to walk through their last attempt. Ask for a specific account: why they opened the product, what materials they had, what they expected after clicking, and what they did instead. A broad question like “Was everything clear?” leaves too much room for a polite answer.
Ask them to show the process using safe data. Let the user control it. If a support employee takes the mouse and finishes setup immediately, you'll learn that the employee knows how to use the service. Nice to know, but not much of a finding.
In a published Participation Studio case study, researchers describe a mismatch between planned onboarding and the jobs visitors to a B2B platform wanted to do: users tried to get to the work they came for while the product required workspace setup. That is a separate project, not proof that your situation is the same. It does offer a useful hypothesis to test.
Connect the cause to a check and an owner
After observing users, record causes in words that lead to action. “Didn't understand which file was needed” suggests a sample file and an explanation beside the upload. “Doesn't have permission to export data” requires the system owner's involvement. “Evaluating the service before quarter-end close” means the actual task hasn't arrived yet.
For the hypothetical reporting service, create a table like this. An observation in the first column doesn't yet confirm the cause in the second; that's what the check is for.
| Observation | Possible cause | What to check | Owner of the fix |
|---|---|---|---|
| Opened upload but didn't choose a file | Doesn't know the export format | Ask them to find the right file without help | Product manager and documentation editor |
| Chose a source but didn't connect | Doesn't have permission to issue a key | Check their source-system role and request to the administrator | Integration owner and customer administrator |
| Sent a file but has no data | Processing ended in an error | Find the operation result and row errors | Engineering |
| Created a report but didn't continue | Report doesn't answer the original question | Ask them to make a real decision using it | Product manager and researcher |
| Created an account and is waiting | The task will arise later | Ask about their work calendar and reason for signing up | Product manager and acquisition team |
When a file was sent, the next investigation concerns import and data readiness, not another welcome screen. If you don't even know where people stop, begin with an audit of one journey.
Don't group these causes under “friction.” You'll lose the owner of the fix. An editor changes text, the customer's administrator handles permissions, and the product team changes the setup order. Sometimes you need to discuss the promise the person heard before signup with sales.
Record technical failures separately: a stuck import, a confirmation email that never arrived, or a lost draft. Training won't fix a failure. A “try again” tooltip on a broken form only gives the problem a neat label. Restore the working path first, then decide whether people need help along it.
Test one fix against the first result
Suppose observations confirmed confusion about the file format. You could limit the change to a sample, a short explanation of the fields, and a link to the export from the right section. Don't redesign signup, pricing, and the entire app at the same time: you'd lose the cause of any result again.
The main check is the share of eligible new accounts that uploaded valid data and received their first report within the chosen window. It also helps to track import errors, format-related support requests, and return to work. Opening a tooltip shows that it was used, but doesn't establish its value on its own.
Write down in advance what observation would disprove the hypothesis. For example, users might upload the file successfully but be unable to understand the finished report. The next investigation would then concern the result, not the input. With a small flow of users, don't turn a difference of a few accounts into a firm conclusion: combine numbers with observation and describe the uncertainty.
Check the promise made before signup against the first journey too. If an ad offers a ready report but the app first demands lengthy data preparation, the stop may start before any interface error. In that case, investigate expectations with the acquisition team. In-product guidance shouldn't explain after the fact that the original promise meant something else.
Keep a short decision record: the chosen group, confirmed cause, owner of the change, and date of the next check. Link to the original observations without unnecessary personal data. A month later, that record can explain why the team chose guidance rather than an import fix. Without it, the discussion can easily start over, especially if the responsible product manager has changed. Record the causes left out of scope separately: waiting for an accountant won't disappear after a copy change and shouldn't count as that change's failure.
Start with one unfinished attempt and reconstruct it through to the end. If the cause really is an explanation of the next step, consider a tour or contextual tooltip in Flowtomate. First establish exactly which step it will help someone take.